

Measuring Belonging
May 25, 2025Written by Ed Cook
One of the Ten Dimensions of Joy at Work is Belonging. It is one of the more obvious dimensions, who doesn’t want to belong; however, measuring belonging is not as obvious. Although we believe there is much that humans can simply intuit about joy attributes, such as belonging, we have found there is power in using analytics to gain insights that might not otherwise readily reveal themselves. Here’s what we mean by belonging.
“My unique capabilities and contributions have value here. I know that because I can see for myself how my capabilities and contributions have value in delivering the organization’s purpose and others communicate my value back to me as well.”
-- Joy at Work: Insights into a joyful work experience based on Joy Research
by Roxanne Brown and Ed Cook
A typical means of knowing how employees evaluate their levels of belonging is a survey. This provides a direct measure but is subjective. We also suggest using a simple tool -- network analysis -- to perform basic quantitative analysis to get an objective viewpoint. The subjective view is still valuable, but paired with the object analysis, even more can be learned.
Network Analysis
Stanley Milgram, a noted psychology researcher, popularized the idea of social connectedness through his six-degrees-of-separation experiments published as The Small World Problem first on Psychology Today and then more rigorously in the journal Sociometry, now called Social Psychology Quarterly. In his studies, he showed that people in the Us could find a connection, on average, to others through only six people. The study of these connections is called network analysis.
“If we are connected to everyone else by six degrees and we can influence them up to three degrees, then one way to think about ourselves is that each of us can reach about halfway to everyone else on the planet.”
― Nicholas A. Christakis, Connected: The Surprising Power of Our Social Networks and How They Shape Our Lives
Network analysis is the study of nodes (often people and places) through their edges (the connections between the nodes). In our case, we are looking at employees in an organization and studying the connections between them. We can use just a few concepts and a free MS Excel™ add-on to gain significant insights into the social structure that underlies an employee’s sense of belonging.
The first concept is connectivity, which refers to the existence and the strength of a connection between a person and all other people in the network. Connectivity is a measure of direct impact and interaction.
The second concept is centrality, which refers to a person’s location in a network. Centrality is a measure of indirect impact and interaction. Connectivity and centrality are complementary measures that provide insights into the behavior of a network -- in our case, a group of people in an organization. There are many tools to measure this, but an easy-to-operate (and free) tool is NodeXL™, which is offered by the Social Media Research Foundation.
You intuitively understand the concepts of connectivity and centrality. The person who seems to know everyone has a high level of connectivity. The person who seems able to network their way to a large number of people has a high level of centrality. You won’t need a tool like NodeXL to know who has high levels of connectivity or centrality. What a tool like NodeXL can do is help you see the people who are left out of the group and therefore must have lower belonging. This means lower Joy at Work. This analysis can also find those who might be critical to increasing the belonging of others, not necessarily because of their connectivity and centrality, but because of their specific location in the network.
A Simple Illustration
Imagine a group of people in an organization, such as a small department in a company. People have joined the company at different times. They have different functions. They have differing levels of ability (and desire) to make connections with others. As a result of all these factors, and others, some are more connected to the network of people. Below is a representation of our imagined group.
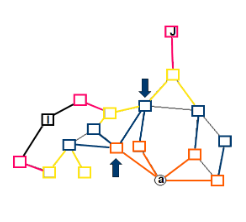
If we look at the network from the point of view of person “a” at the bottom of the diagram, we can notice a few things just by making this depiction.
- The colors show how many connections between one person and every other person in the group. Orange is one connection away; blue is two connections away; then all the way to black, which is person “I” who is five connections away.
- We see a very isolated person, like person “J”, at the top of the diagram. You’ll notice there is another similarly isolated person in the diagram.
With an analytical tool like NodeXL, we can find other important aspects of this group. We may not notice without some help that the group is really split into two, with the two people shown by the arrows acting as gatekeepers between the two sections of the group. Should those two people leave the organization, the group would be split into two subgroups. If part of belonging is actually being connected to others, then increasing connections between the two subgroups would help. There are several other insights that can be discovered in minutes with network analysis, and although it is fairly easy to look across this group and glean these insights, imagine the difficulty of doing it with 50 or 100.
